


Pandas is an excellent choice for beginning your data science journey. In a previous post we have seen how to open and read data from a CSV file. In this post, we will go beyond and get more information, this time using weather data.
Let us get the weather data from Kaggle, the storehouse for datasets. Every data science enthusiast has gained experience working with these datasets.
You can work there on the Kaggle platform entirely in the cloud. Nothing to install locally. I have covered it in another post.
We will work with Delhi Weather data downloaded from Kaggle. We will begin with loading the file and opening it in Pandas.
First, install Pandas , if you are working on your local workstation.
import pandas as pd

filepath = 'path_to_csv_file'
df = pd.read_csv(filepath)
It is conventional to use pd as an alias for Pandas. Load and read the CSV file with _readcsv() method. It returns a dataframe df .
Pandas dataframe is a table of rows and columns. If you have used a spreadsheet or a database table, then you are good to go. As a programmer, you may think of it as a two-dimensional array.
Let's see what we can learn about the weather data from the dataframe.
head()
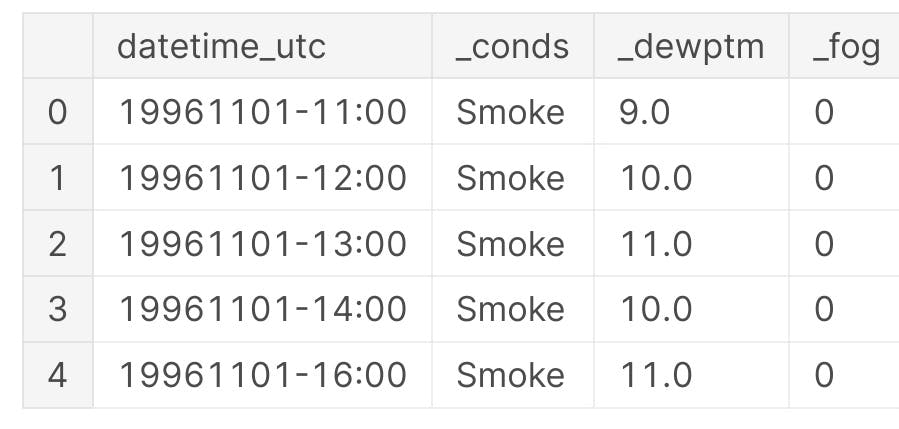
df.head()
The head() function returns the first five rows. We get our first look at the data.
 tail()
You want to see the last few rows, then use the tail() function.
df.tail(3)
You may specify the number of columns as a parameter to both head() and tail() functions; the default is 5 rows.
info()
The info() function provides the following details.
- size of the dataset (kb)
- number of rows
- number of columns
- data type of the columns
- column names
- non-null count of column values
df.info()
Output
<class 'pandas.core.frame.DataFrame'>
RangeIndex: 100990 entries, 0 to 100989
Data columns (total 20 columns):
 #   Column        Non-Null Count   Dtype
---  ------        --------------   -----
 0   datetime_utc  100990 non-null  object
 1    _conds       100918 non-null  object
 2    _dewptm      100369 non-null  float64
 3    _fog         100990 non-null  int64
 4    _hail        100990 non-null  int64
 5    _heatindexm  29155 non-null   float64
 6    _hum         100233 non-null  float64
 7    _precipm     0 non-null       float64
 8    _pressurem   100758 non-null  float64
 9    _rain        100990 non-null  int64
 10   _snow        100990 non-null  int64
 11   _tempm       100317 non-null  float64
 12   _thunder     100990 non-null  int64
 13   _tornado     100990 non-null  int64
 14   _vism        96562 non-null   float64
 15   _wdird       86235 non-null   float64
 16   _wdire       86235 non-null   object
 17   _wgustm      1072 non-null    float64
 18   _windchillm  579 non-null     float64
 19   _wspdm       98632 non-null   float64
dtypes: float64(11), int64(6), object(3)
memory usage: 15.4+ MB
Shape
The dataframe has a shape property. It holds the number of rows and columns as a tuple.
df.shape
Try it. The output can be used in your program because it is a data structure.
Output
(100990, 20)
columns
The columns property returns the names of the columns. This is useful especially when you want to rename a few columns that you are interested in.
df.columns
Output
Index(['datetime_utc', ' _conds', ' _dewptm', ' _fog', ' _hail', ' _heatindexm', ' _hum', ' _precipm', ' _pressurem', ' _rain', ' _snow', ' _tempm', ' _thunder', ' _tornado', ' _vism', ' _wdird', ' _wdire', ' _wgustm', ' _windchillm', ' _wspdm'], dtype='object')
copy()
Sometimes you need to keep the original dataframe unchanged. You would rather work on a copy for all your experiments before you change the original dataframe. The copy() function will return a clone of the original and any modifications you make on the copy (like changing column names) will not affect the original.
df_copy = df.copy()
rename()
We will change some column names on the copy. The modified names are easily remembered, unlike the original names.
df_copy.rename(columns={
    ' _conds' : 'conditions',
    ' _dewptm': 'dew point'
}, inplace=True)
The rename() function accepts a dictionary of column names as keys and their new names as values. The parameter inplace specifies whether the data is to be modified on the dataframe. We say yes, because we are after all working on a copy.
Output
Index(['datetime_utc', 'conditions', 'dew point', ' _fog', ' _hail',
       ' _heatindexm', ' _hum', ' _precipm', ' _pressurem', ' _rain', ' _snow',
       ' _tempm', ' _thunder', ' _tornado', ' _vism', ' _wdird', ' _wdire',
       ' _wgustm', ' _windchillm', ' _wspdm'],
      dtype='object')
We have changed the names of the second and third columns. Check with the output from df.columns above.
Note
The copy() function fails without any message if the column name in the rename function does not match that in the dataframe.
isnull()
Before we start building our stats on the data, we need to check if there are any missing values.
The function isnull() returns True for NaN values
bool_dewpoint = pd.isnull(df_copy['dew point'])
Output
0         False
1         False
2         False
3         False
4         False
          ...
100985    False
100986    False
100987    False
100988    False
100989    False
Name: dew point, Length: 100990, dtype: bool
Displays True for NaN values. NaN stands for Not A Number and is Pandas way of displaying null or missing values.
Here's the output for df_copy[bool_dewpoint]
     datetime_utc     _conds     _dewptm     _fog     _hail     _heatindexm     _hum     _precipm     _pressurem     _rain     _snow     _tempm     _thunder     _tornado     _vism     _wdird     _wdire     _wgustm     _windchillm     _wspdm
124     19961108-01:00     Smoke     NaN     0     0     NaN     NaN     NaN     1014.0     0     0     NaN     0     0     2.0     0.0     North     NaN     NaN     0.0
240     19961113-02:00     Smoke     NaN     0     0     NaN     NaN     NaN     1012.0     0     0     NaN     0     0     NaN     280.0     West     NaN     NaN     5.6
303     19961116-06:00     Unknown     NaN     0     0     NaN     NaN     NaN     -9999.0     0     0     NaN     0     0     NaN     0.0     North     NaN     NaN     NaN
520     19961126-04:00     Smoke     NaN     0     0     NaN     NaN     NaN     1017.0     0     0     NaN     0     0     1.6     0.0     North     NaN     NaN     0.0
584     19961129-18:00     Smoke     NaN     0     0     NaN     NaN     NaN     -9999.0     0     0     NaN     0     0     0.7     0.0     North     NaN     NaN     0.0
...     ...     ...     ...     ...     ...     ...     ...     ...     ...     ...     ...     ...     ...     ...     ...     ...     ...     ...     ...     ...
96965     20160907-08:30     Haze     NaN     0     0     NaN     NaN     NaN     1005.0     0     0     NaN     0     0     4.5     320.0     NW     NaN     NaN     9.3
97259     20160924-12:30     Haze     NaN     0     0     NaN     NaN     NaN     1002.0     0     0     NaN     0     0     3.0     0.0     North     NaN     NaN     0.0
98049     20161025-07:30     Widespread Dust     NaN     0     0     NaN     NaN     NaN     1009.0     0     0     NaN     0     0     3.5     280.0     West     33.3     NaN     14.8
99347     20161221-05:30     Haze     NaN     0     0     NaN     NaN     NaN     1018.0     0     0     NaN     0     0     3.0     270.0     West     NaN     NaN     11.1
99716     20170108-03:00     Patches of Fog     NaN     1     0     NaN     NaN     NaN     1016.0     0     0     NaN     0     0     0.5     NaN     NaN     NaN     NaN     0.0

621 rows × 20 columns
Note
621 rows of dew point column have NaN or null values.
dropna()
Remove NaN values with the function dropna().
Caution When you call dropna() on a dataframe, all the rows that contain at least one NaN value will be deleted.
You can try it on the copy. You can experiment on the copy to your heart's content.
df_copy.dropna()
After you are satisfied that it works, you can restore the copy again from the original.
You can drop columns only instead of rows by passing in the axis parameter.
df_copy.dropna(axis=1)
This is still not good enough. Instead of removing data, we need to replace NaN values with something meaningful, like 0 or the mean of the column.
fillna()
The fillna() function replaces the NaN values with whatever you pass as a parameter.
We will fill the _tempm column with its mean value.
mean()
Find the mean of the temperature column.
temps = df_copy[' _tempm']
mean_temp = temps.mean()
We will use this value to fill in the temperature column.
Before we do that, let's count the number of missing values in the dataframe.
missing values
df_copy.isnull().sum().sum()
Output
411805
Let us now do the replacement.
temps.fillna(mean_temp, inplace=True)
Let us again check to see how this affects the number of missing values. Calling df_copy.isnull().sum().sum() again, we get the output `411132.
We have now successfully replaced the NaN values in the temperature column!
describe()
We have come to the last item in this post, namely the describe() function. It gives us the following statistics from the dataframe.
If you look at the first column in the output, you will see data pertaining to the the following:
- count
- mean
- std
- min
- 25%
- 50%
- 75%
- max
df_copy.describe()
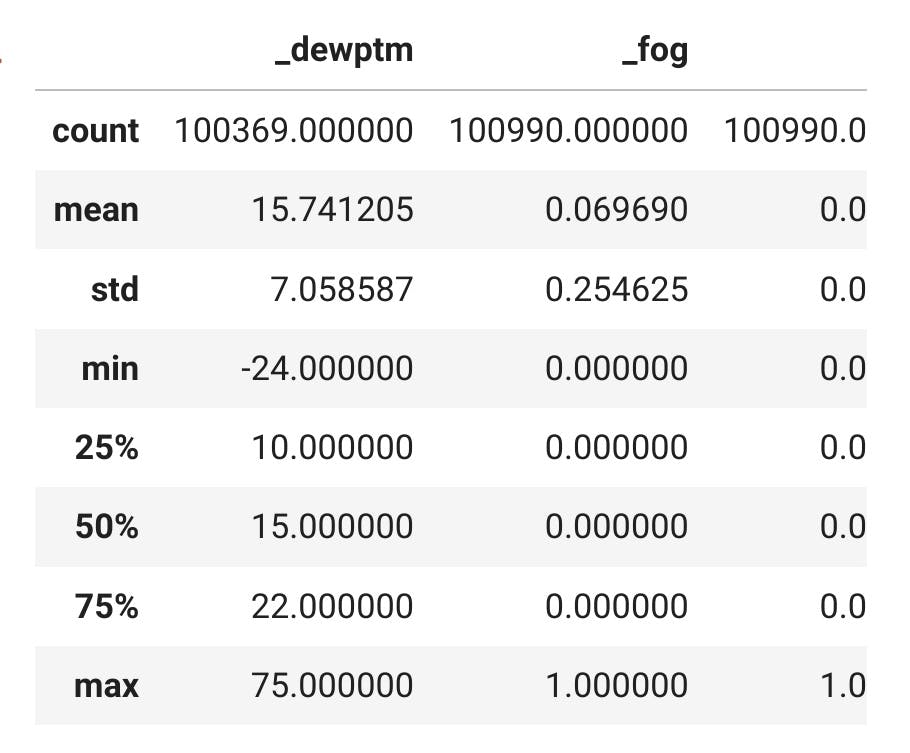
What do these statistics mean?
- count of the number of columns
- mean of the columns
- standard variation
- percentile values of columns
- median (or 50th percentile)
- minimum and maximum values
Do data science. Begin here.
Happy coding!